There are 3,700,000,000 internet users in 2017.
Number of Websites in 2017
There are almost 966 million websites, but this is not the high water mark. In 2014, the internet crossed the 1 billion mark.

Web Growth Statistics
The fastest growing segment of the internet is the number of mobile social media users. The number of people who used mobile devices to access social media grew by more than 280 million globally from 2015 to 2016.

Mobile Internet Penetration
The U.S. and the U.K. do not rank in the top 10 markets in terms of smartphone penetration. The UAE leads this statistic with 91% penetration.

Global and U.S. E-Commerce Trends
Statistics on Internet Research before a Purchase
People between 18 and 35 years old do the most online research via mobile devices.

Facts and Statistics about Product Reviews
Think reviews are important? You’re right! 55% of shoppers said customer reviews affect their buying decisions.

In addition, almost 40% of people in stores read online reviews before buying a product or service.

E-commerce Spending Via Desktops
When it comes to online purchasing, people on Macs do more than people on any other platform.

World E-commerce Statistics
Business to Consumer sales (B2C) are up globally from 2015. The Asian-Pacific nations lead this category, with an expected $707 billion + of sales in 2017.

Who Uses the Internet to Shop?
The U.S. leads in overall e-commerce spending.

Internet Trends: Device Comparisons
Number of SmartPhone Users
While several forecasts pegged 2014 as the “year of revolution” when mobile-only users would surpass desktop-only users, it turns out the forecast finally became reality in the U.S. in 2015.

Use Patterns: Mobile vs Desktop
Mobile is the fastest growing platform in terms of time spent on-screen. This means more people are spending time on their phones versus time on their desktops.

U.S. Platform Trends
In the U.S. the fastest growing segments of device ownership are smartphones (from 35% in 2011 to 68% in 2015) and tablets (from 3% in 2010 to 45% in 2015).

Percentage of Mobile Web Internet Traffic
An astonishing 76% of Nigeria’s total web traffic comes from mobile devices. In the U.S., mobile web accounted for 22% of the overall traffic.

Tablet Internet Use
Tablet penetration has risen slowly over the past couple of years. By 2020, tablets will be used by 35% of all internet users.

Mobile vs Laptop: Types of Activities 2017
Nearly as many people aged 16 – 24 use phones to chat as they do laptops. However, laptops still dominate streaming content

Desktop vs Mobile vs Tablets in the U.K.
In the U.K., the number of people who own multiple devices grew from 53% in July of 2015 to 57% in December.

VPN Use 2017
Of course, VPN use and data privacy have strong correlations. By accessing a separate server for internet use, VPNs make it much more difficult for hackers and/or 3rd parties to track online activities. The following charts examine the current state of VPN use around the globe.
Top Markets for VPN Use
Asia and the Middle East continue to dominate the VPN market.

Internet Trends: Performance
How Load Time Affects Web Page Abandonment
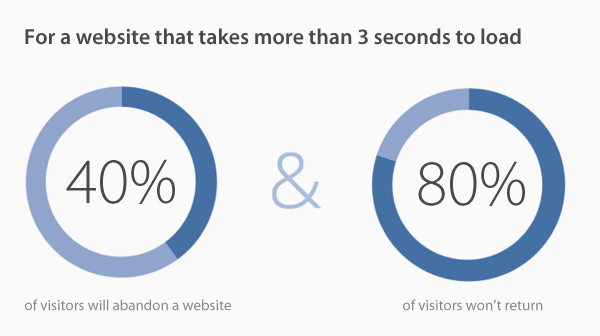
While web page features such as plug-ins, pop-ups, and streaming video may help convey your message, they hinder the page load time. As the following charts show, a page that takes longer than 3 seconds to load runs a high risk of abandonment.


Global Internet Speed Trend
Good news: internet speeds around the globe are at their highest peak ever.

Internet Trends: Search and Social Media
Most Popular U.S. Online Activities
In the U.S. last year, communication activities such as email (almost 91%) and instant/text messaging (86%) dominated.

Content Management System Trends
WordPress continued to win content management market share with nearly 60%. The No. 2 system, Joomla, had a 5.9% market share.

Percentage of Google Chrome Users
In terms of web browsers used, Google Chrome continues to thrive. According to the latest numbers from w3schools, it is more than 4 times as popular as its next closest competitor (Firefox).

Percent of Internet Time Spent on Search Engine/Social Media, etc.
The top 3 activities for desktop users in terms of time spent in 2015: Portals (Google, Yahoo, etc.), business/finance, and entertainment/news. The top 3 activities for Mobile device users: maps, photos, and games.

Percent of Most Visited Websites
Google wants to be the internet’s portal, and it is well on its way. The internet giant’s flagship page nearly tripled the 2nd place website (Facebook) in terms of page visits.

2017 U.S. Online Shopping
In terms of U.S. e-commerce, Pinterest is lapping the field.

Forecast and Trends for 2017 and Beyond
Currently, mobile users spend double the time in apps as they do on mobile web pages. In future years, this gap is expected to grow even wider.
Mobile App vs Mobile Web

Worldwide E-commerce Forecast
By 2018, global retail e-commerce sales are expected to approach $2.5 trillion.


